Running power from the wrist
Running power is a great complement to heart rate monitoring – it helps you monitor the external load of your running. Power responds to changes in intensity faster than your heart rate, which is why Running Power is a great guiding metric in interval and hill sessions. You can also use it to maintain a steady effort level during your run, for example in a race.
The calculation is done with Polar’s proprietary algorithm, and it is based on your GPS and barometer data. Your weight also affects the calculation, so make sure its up-to-date.
Running power and muscle load
Polar uses running power to calculate Muscle load, one parameter of Training Load Pro. Running causes musculoskeletal stress, and Muscle load tells you how much your muscles and joints were strained during your training session. It shows the amount of mechanical work (kJ) that you produced during your running sessions (and cycling sessions if you’re using a cycling power meter). Muscle load helps you quantify your training load in high-intensity running training sessions, such as short intervals, sprints and hill sessions, when your heart rate doesn’t have enough time to react to the changes in the intensity.
How running power is shown on your watch
Running power is automatically calculated for your running sessions done with running type sport profiles with GPS available.
Choose the power data you want to view during your sessions by customizing your training views in the Flow web service sport profile settings.
During your run you can view the following data:
- Maximum power
- Average power
- Lap power
- Maximum lap power
- Automatic lap power average
- Automatic lap power maximum
Choose how power is shown during sessions and in the Flow web service and app:
- Watts W
- Watts per kilogram W/kg
- Percentage of MAP (% of MAP)
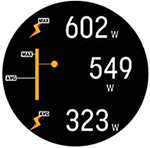
After your session in the training summary on your watch you’ll see:
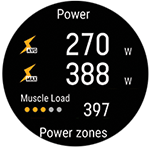
- Your average power as Watts
- Your maximum power as Watts
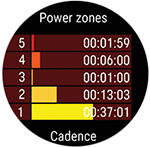
- Muscle Load
- Time spent in power zones
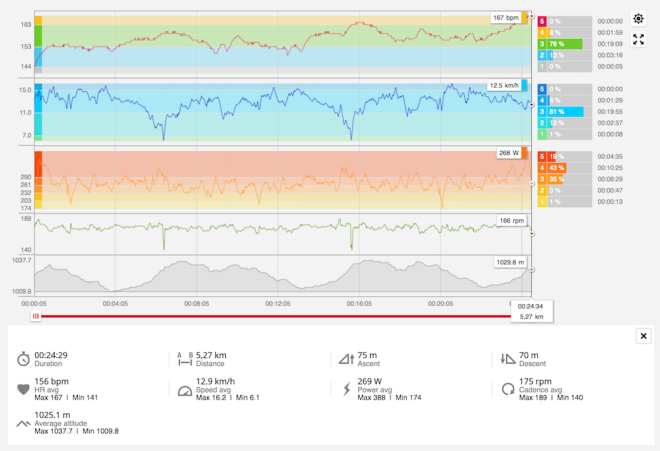
How running power is shown in the Polar web service and app
Detailed graphs for analysis are available in the Flow web service and app. See your power values from your session, and how they were distributed compared to heart rate, and how incline, decline and different speeds affected them.