Training Load Pro
The Training Load Pro™ feature measures how your training sessions strain your body and helps to understand how it impacts your performance. Training Load Pro gives you a training load level for your cardiovascular system called Cardio Load, and with Perceived Load you can rate how strained you feel. Training Load Pro also gives you a training load level for your musculoskeletal system (Muscle Load). When you know how strained each body system is, you can optimize your training by working the right system at the right time.
Cardio Load
Cardio Load is based on training impulse calculation (TRIMP), a commonly accepted and scientifically proven method to quantify training load. Your Cardio Load value tells you how much strain your training session put on your cardiovascular system. The higher the Cardio Load, the more strenuous the training session was for the cardiovascular system. Cardio Load is calculated after every workout from your heart rate data and session duration.
Perceived Load
Your subjective feeling is one useful method of estimating training load for all sports. Perceived Load is a value that takes into account your own subjective experience of how demanding your training session was and the duration of your session. It's quantified with Rate of Perceived Exertion (RPE), a scientifically accepted method to quantify subjective training load. Using the RPE scale is especially useful for sports where measuring training load based on heart rate alone has its limitations, for example strength training.
Rate your session in the Flow mobile app to get your Perceived Load for the session. You can choose from a scale from 1-10, in which 1 is very, very easy and 10 is maximum effort.
Muscle Load
Muscle Load tells you how much your muscles were strained during your training session. Muscle Load helps you quantify your training load in high-intensity training sessions, such as short intervals, sprints and hill sessions, when your heart rate doesn’t have enough time to react to the changes in the intensity.
Muscle load shows the amount of mechanical energy (kJ) that you produced during a running or cycling session. This reflects your energy output, not the energy input it took you to produce that effort. In general, the fitter you are, the better the efficiency between your energy input and output. Muscle load is calculated based on power and duration. In case of running, also your weight counts.
Muscle Load is calculated from your power data, so you only get a Muscle Load value for your running workouts, and cycling sessions if you’re using a separate cycling power sensor.
Training Load from a single session
Your Training Load from a single session is shown in the summary of your training session on your watch, in the Flow app and in the Flow web service.
You'll get an absolute training load number for each measured load. The higher the load, the more strain it caused to your body. In addition, you can see a visual bullet scale interpretation and a verbal description of how hard your training load from the session was compared to your 90 days training load average.

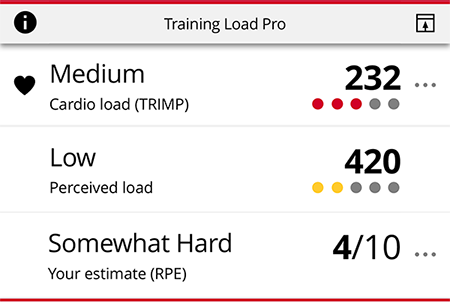
The scale of bullets and verbal descriptions adapts according to your progress: the smarter you train, the higher loads you tolerate. As your fitness and tolerance for training improves, a training load that was ranked worth 3 bullets (Medium) a couple of months ago, could rank for only 2 bullets (Low) later on. This adaptive scale reflects the fact that the same kind of training session can have a different impact on your body depending on your current condition.

Very high

High

Medium

Low

Very low
Strain and Tolerance
In addition to the Cardio load from individual training sessions, the new Training Load Pro feature measures your short term Cardio load (Strain) and long term Cardio load (Tolerance).
Strain shows you how much you have strained yourself with training lately. It shows your average daily load from the past 7 days.
Tolerance describes how prepared you are to endure cardio training. It shows your average daily load from the past 28 days. To improve your tolerance for cardio training, you need to slowly increase your training over a longer period of time.
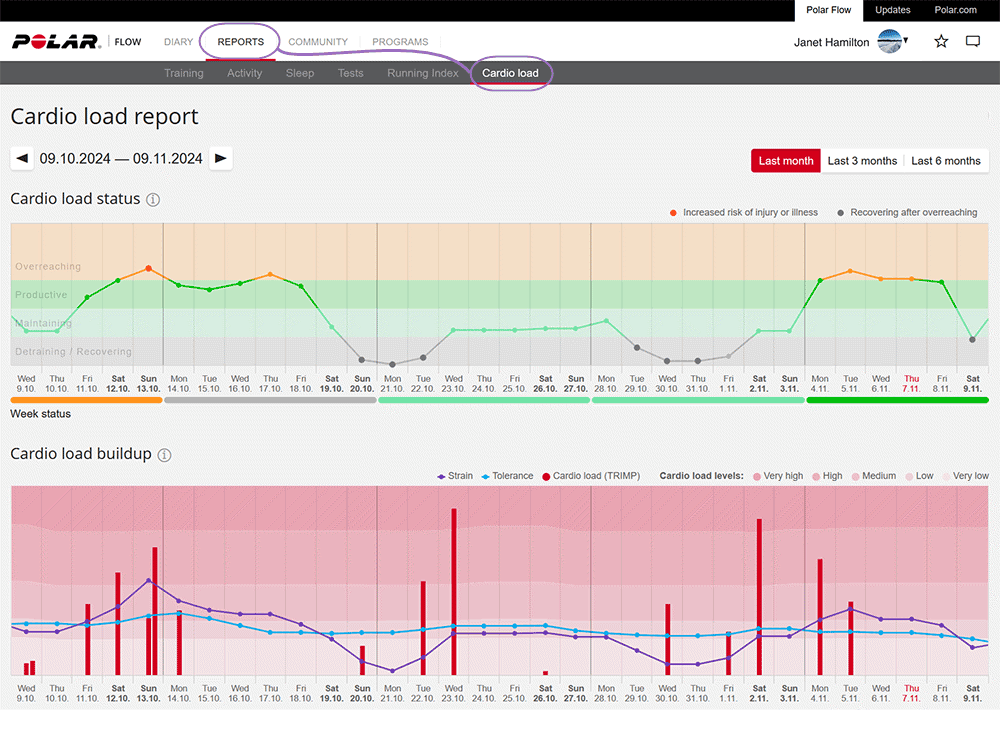
Cardio Load Status
Cardio load status looks at the relation between your Strain and Tolerance and based on that shows you whether you are in a detraining, maintaining, productive or overreaching Cardio load status. You will also get personalized feedback based on your status.
Cardio load status guides you in evaluating the impact your training has on your body and how it affects your progress. Knowing how your past training affects your performance today allows you to keep your total training volume in control and optimize the timing of training at different intensities. Seeing how your training status changes after a session helps you understand how much load was caused by the session.
Cardio load status on your watch
In time view, use the UP and DOWN buttons to navigate to the Cardio Load Status watch face.

- Cardio load status graph
- Cardio load status
 Overreaching (Load much higher than usual):
  Productive (Load slowly increasing)
 Maintaining (Load slightly lower than usual)
 Detraining (Load way lower than usual)
 - The numeric value for your Cardio load status (=Strain divided by Tolerance.)
- Strain
- Tolerance
- Verbal description of your Cardio load status
The Cardio Load Status calculation in the Flow app and web service has been updated to provide more actionable feedback in situations where the load has been low, such as when you are just starting to train or recovering after an intensive training period. We have added a new status, "Recovering", and adjusted the feedback of low cardio load to better reflect when you are training at a productive level. In certain situations, the feedback displayed on your watch may differ from the updated feedback shown in the Flow app and web service. For more information, see the support document Updated Cardio Load Status feedback in the Flow app and web service.
Long term analysis in the Flow app and web service
In the Flow app and web service you can follow how your Cardio Load builds up over time and see how your Cardio loads have varied over the past week or months. To view your Cardio Load Buildup in the Flow app, tap the vertical three dots icon in the week summary (Cardio Load Status module) or in the training summary (Training Load Pro module).

To view your Cardio load status and Cardio load buildup in the Flow web service, go to Reports > Cardio Load.
Cardio load status
Overreaching (Load much higher than usual):
Productive (Load slowly increasing)
Maintaining (Load slightly lower than usual)
Detraining / Recovering (Load lower than usual)

|
The red bars illustrate the cardio load from your training sessions. The higher the bar, the harder the session was on your cardio system. |

|
The background colors show how hard a session was compared to your session average from the past 90 days, just like the scale of five bullets and verbal descriptions (Very low, Low, Medium, High, Very high). |

|
Strain shows how much you have strained yourself with training lately. It shows your average daily cardio load from the past 7 days. |

|
Tolerance describes how prepared you are to endure cardio training. It shows your average daily cardio load from the past 28 days. To improve your tolerance for cardio training, slowly increase your training over a longer period of time. |
Learn more about the Polar Training Load Pro feature in this in-depth guide.